
Lesce enjoys nice, sunny summers when days are long and temperatures can often exceed 25°C, particularly in July and August. However the summer months are also unpredictable, and odd days can rapidly change from sunshine to rain. The winter months in Lesce, by contrast, are bitterly cold, with snow and frosty days when temperatures hover at or just below freezing. Rain can fall all year round, but the wettest months are October and November, and the driest on average January and February.
When to go – the best time to visit Lesce
The summer climate is always the most popular time to visit Lesce, and even the evening temperatures are favourable, enticing people to sit on the terraces, outside of central bars and restaurants. Autumns in Lesce are fairly long, since the summers can be short. When the winter climate arrives, heavy overnight frosts add a noticeable crispness to the air, followed soon by spells of snowy weather. Spring is usually quite early and by the end of April, flowers are blooming and the trees quickly burst back into life, with daytime temperatures staying above 10°C.

LESCE YEARLY WEATHER SUMMARY
What’s the best time to visit Lesce in Slovenia? Here are some facts:
– The months May, June, July, August and September have a nice average temperature.
– July is the warmest month with an average high of 25,3 °C and an average low of 13,3 °C.
– July is also the month with the most sunshine, with almost 9 hours per day.
– January is the coolest month with an average high of 3,0 °C and an average low of -5,6 °C.
– October and November are the wettest months with an average of 157 millimeters of precipitation.
– November and December are the most cloudy months with an average of 14 mostly cloudy days.
– January is the driest month with an average of 63 millimeters of precipitation.
– January is the month with the highest number of days with snow cover – 15 days.
– January is the month with the most snowfall, with a little over 32 centimetres on average.
For more specific information about the climate of Lesce, Slovenia, please take a look at the graphs shown below.

A climate graph for Lesce, Slovenia showing mean daily maximum and minimum temperature for a month and average monthly precipitation (rain/snow).
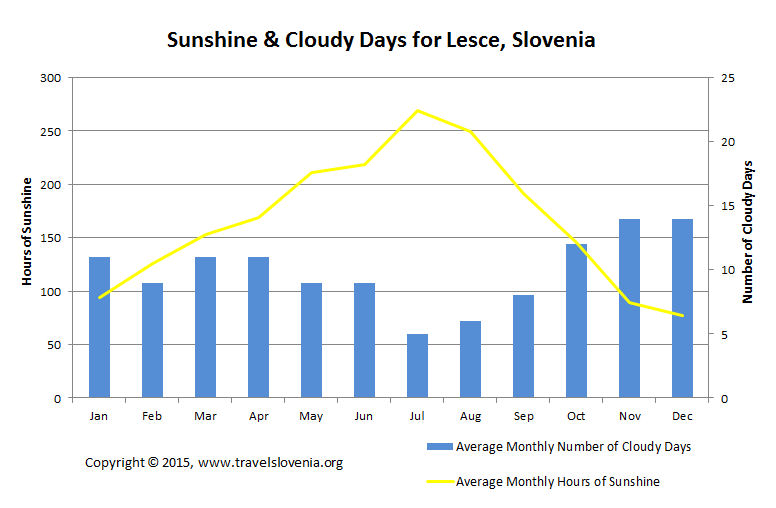
Graph showing average monthly hours of sunshine and average monthly number of cloudy days for Lesce, Slovenia.

Graph showing average monthly number of days with precipitation, average monthly number of days with snow cover and average monthly snowfall (in cm) for Lesce, Slovenia.

Graph showing average monthly number of hot and cold days for Lesce, Slovenia.