Located on the very northeastern corner of Slovenia, the continental climate of Murska Sobota is usually quite pleasant and whilst the winter months can be rather cold, the springtime weather is never far away. Summers in Murska Sobota are usually pleasantly warm, rather than scorching hot.
In close proximity to the Alps, the climate in Murska Sobota is classified as continental, with periods of snow and frost between December and February.
When to go – the best time to visit Murska Sobota
The highest temperatures can be expected in both July and August and average around 23°C, occasionally topping 27°C or even 30°C. However, rainy weather and even thunderstorms are also likely at this time, and whilst the heart of the summer is a good time to visit Murska Sobota, come prepared for periodic wet spells and downpours.
January is the coldest month in Murska Sobota and features night-time temperatures below 0°C. Snowy weather in some description usually falls during the winters and remains on the ground for a week or two before finally melting away.
Both spring and autumn can be appealing times to stay in Murska Sobota and the surrounding area, when the climate is a little more stable and drier. However, any time between May and October is a good time to visit, and even the winter months have a charm or their own.
MURSKA SOBOTA YEARLY WEATHER SUMMARY
What’s the best time to travel to Murska Sobota in Slovenia? Here are some facts:
– The months May, June, July, August and September have a nice average temperature.
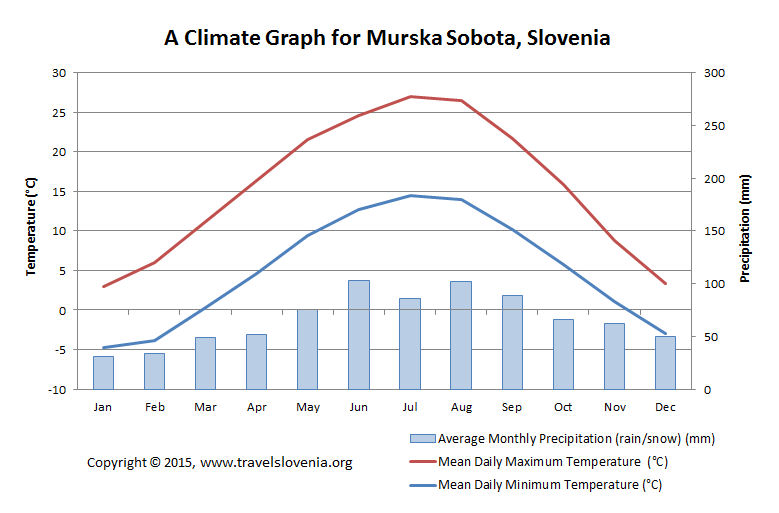
– July is the warmest month with an average high of 27,0 °C and an average low of 14,4 °C.
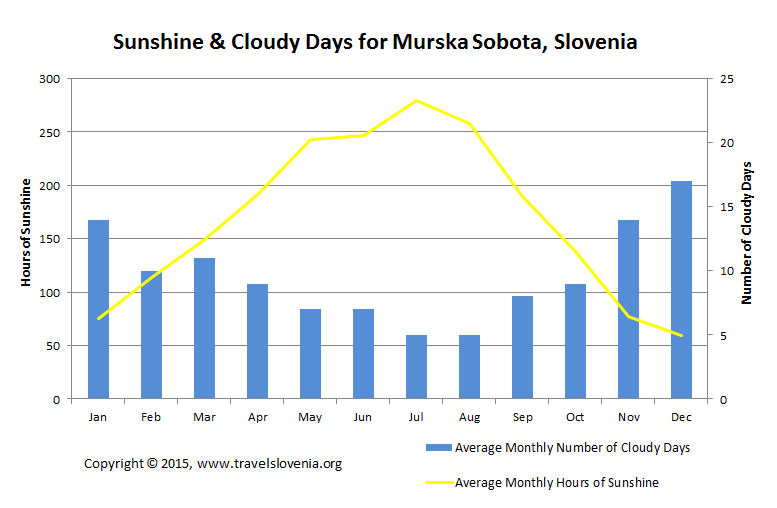
– July is also the month with the most sunshine, with 9 hours per day.
– January is the coolest month with an average high of 2,9 °C and an average low of -4,8 °C.
– June is the wettest month with an average of 103 millimeters of precipitation.
– December are the most cloudy months with an average of 17 mostly cloudy days.
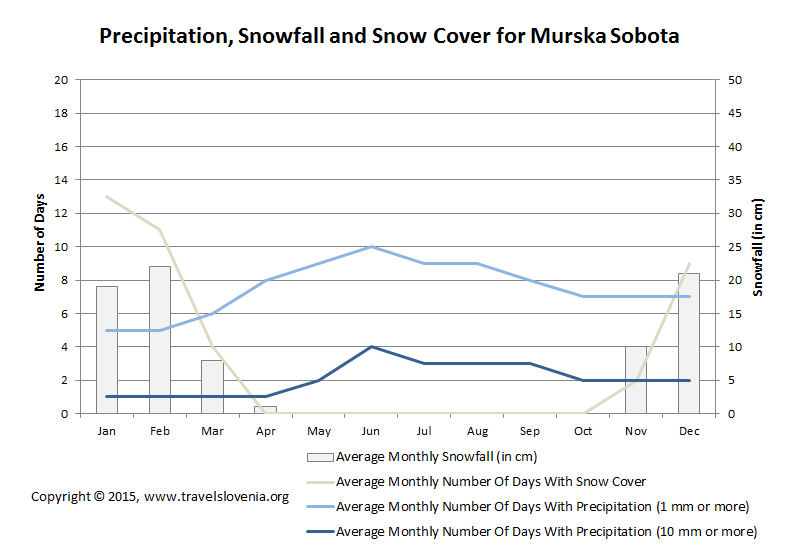
– January is the driest month with an average of 31 millimeters of rainfall.
– February is the month with the most snowfall, with a little over 22 centimetres on average.
For more specific information about the climate of Murska Sobota, Slovenia, please take a look at the graphs shown below.
A climate graph for Murska Sobota, Slovenia showing mean daily maximum and minimum temperature for a month and average monthly precipitation (rain/snow).
Graph showing average monthly hours of sunshine and average monthly number of cloudy days for Murska Sobota, Slovenia.
Graph showing average monthly number of days with precipitation, average monthly number of days with snow cover and average monthly snowfall (in cm) for Murska Sobota, Slovenia.
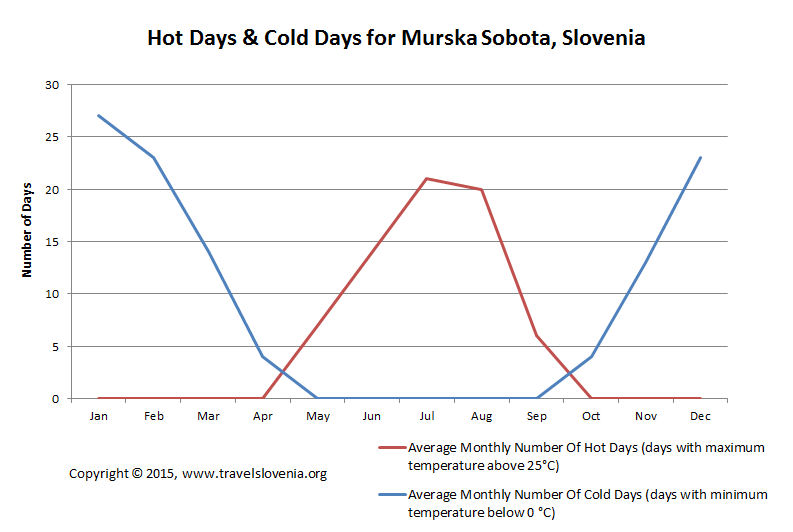
Graph showing average monthly number of hot and cold days for Murska Sobota, Slovenia.