The climate in Celje features distinct seasons, namely winter and summer. Spring and autumn are still apparent, but the weather at these times of the year merges between Celje’s more obvious seasons, remaining much more short-lived.
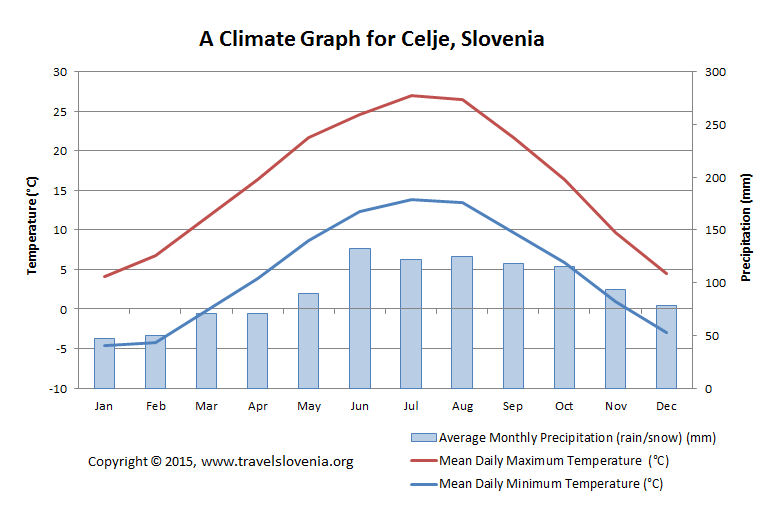
The summer climate in Celje is when the city is at its busiest and the very peak of the tourist season falls between June and August. This is when the days are at their longest and the sunny weather is at its most prevalent, although June can be a little damp at times and with 132 mm of rain, this is usually the wettest month, with infrequent downpours interspersed with strong spells of sunshine.
When to go – the best time to visit Celje
Summer highs in Celje can be anywhere between 25°C and 30°C, with sporadic heat waves, although in most cases daytime temperatures average 23°C or 24°C. If you prefer to escape from the crowds and visit the city when it is a little quieter, then late spring or early summer (mid-May and June) is a good time to consider, when the flowers are fresh and the climate is still warming up, with daytime temperatures averaging around 20°C. December and January are the coldest months in Celje, with daytime temperatures between 0°C and 5°C. Although the winter climate is chilly, the Christmas and New Year’s celebrations often attract crowds to Celje.
CELJE YEARLY WEATHER SUMMARY
What’s the best time to travel to Celje in Slovenia? Here are some facts:
– The months May, June, July, August, and September have a nice average temperature.
– July is the warmest month with an average high of 26,9 °C and an average low of 13,8 °C.
– July is also the month with the most sunshine, with 8hours per day.
– January is the coolest month with an average high of 4,1 °C and an average low of -4,6 °C.
– June is the wettest month with an average of 132 millimeters of precipitation.
– December is the most cloudy month with an average of 16 mostly cloudy days.
– January is the driest month with an average of 47 millimeters of rainfall.
– February is the month with the most snowfall, with 23 centimetres on average.
For more specific information about the climate of Celje, Slovenia, please take a look at the graphs shown below.

A climate graph for Celje, Slovenia showing mean daily maximum and minimum temperature for a month and average monthly precipitation (rain/snow).

Graph showing average monthly hours of sunshine and average monthly number of cloudy days for Celje, Slovenia.

Graph showing average monthly number of days with precipitation, average monthly number of days with snow cover and average monthly snowfall (in cm) for Celje, Slovenia.

Graph showing average monthly number of hot and cold days for Celje, Slovenia.

