Offering a moderate climate with no real temperature extremes, the weather in Lasko combines elements from both eastern and western Europe. The summer climate in Lasko is warm, agreeable and at times even a little hot, while the winter weather gradually arrives at the end of November and by January and February, the temperatures are feeling a touch crisp, both by day and night.
July is usually the hottest month in Lasko and sees temperatures average around 23°C or 24°C. However, during the very sunniest of weather, highs of more than 30°C can be expected. January tends to be the coldest month, in the midst of winter, when the climate hovers between 0°C and 5°C by day and falls to between -5°C and 0°C by night.
When to go – the best time to visit Lasko
Spring is always a good time to visit Lasko and the weather soon becomes more inviting in April and May, showing that the summer climate is not far away. Springtime showers are to be expected at times, along with plenty of blossoms and flowering bulbs within the main parks. Summer highs in Lasko can be anywhere between 25°C and 30°C, with sporadic heat waves, although in most cases daytime temperatures average 23°C or 24°C.
LASKO YEARLY WEATHER SUMMARY
What’s the best time to travel to Lasko in Slovenia? Here are some facts:
– The months May, June, July, August, and September have a nice average temperature.
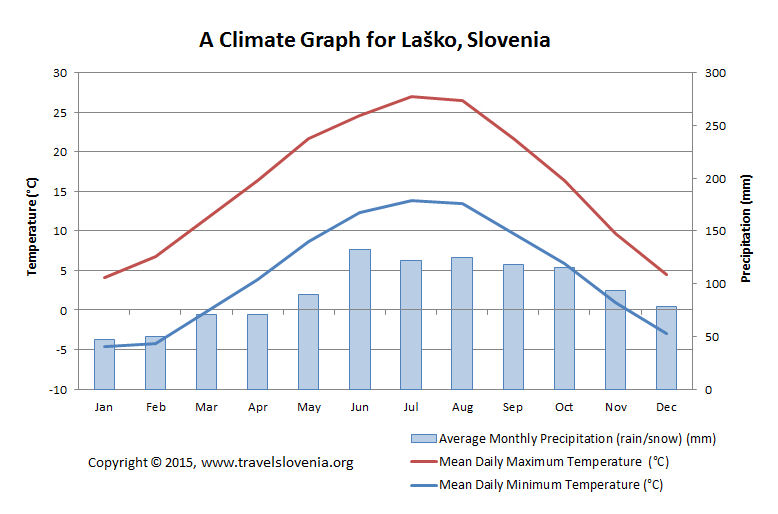
– July is the warmest month with an average high of 26,9 °C and an average low of 13,8 °C.
– July is also the month with the most sunshine, with 8 hours per day.
– January is the coolest month with an average high of 4,1 °C and an average low of -4,6 °C.
– June is the wettest month with an average of 132 millimeters of precipitation.
– December is the most cloudy month with an average of 16 mostly cloudy days.
– January is the driest month with an average of 47 millimeters of rainfall.
– February is the month with the most snowfall, with 23 centimetres on average.
For more specific information about the climate of Lasko, Slovenia, please take a look at the graphs shown below.

A climate graph for Lasko, Slovenia showing mean daily maximum and minimum temperature for a month and average monthly precipitation (rain/snow).

Graph showing average monthly hours of sunshine and average monthly number of cloudy days for Lasko, Slovenia.

Graph showing average monthly number of days with precipitation, average monthly number of days with snow cover and average monthly snowfall (in cm) for Lasko, Slovenia.

Graph showing average monthly number of hot and cold days for Lasko, Slovenia.

