
Whilst temperatures may vary from year to year, Nova Gorica tends to enjoy a pleasant climate all year round. The spring and autumn are generally the best seasons to visit Nova Gorica. During the summer climate, Nova Gorica basks in fairly high temperatures, although the hot, sunny weather can be often punctuated by the thunderstorm.
When to go – the best time to visit Nova Gorica
Spring in Nova Gorica can be very pleasant. Expect to enjoy some balmy weather with the shower or two. During June, temperatures during the day can reach as high as 25°C. The summer Nova Gorica climate can be fairly hot. Daytime temperatures are usually between 25°C and 30°C, and can often exceed 30°C.

September and October are still pleasant months, although visitors can expect more in the way of rain showers, as October approaches. Late-autumn travelers are advised to bring plenty of warm clothing. From late-November through to January and February, the weather and climate in Nova Gorica is very much characterised by cold days. Daytime temperatures are usually between 0°C and 10°C on average.
NOVA GORICA YEARLY WEATHER SUMMARY
What’s the best time to travel to Nova Gorica in Slovenia? Here are some facts:
– The months May, June, July, August, September and October have a nice average temperature.
– July is the warmest month with an average high of 28,7 °C and an average low of 16,7 °C.
– July is also the month with the most sunshine, with 9 hours per day.
– January is the coolest month with an average high of 8,0 °C and an average low of 0,3 °C.
– October is the wettest month with an average of 176 millimeters of precipitation.
– December and January are the most cloudy months with an average of 13 mostly cloudy days.
– February is the driest month with an average of 71 millimeters of rainfall.
– January is the month with the most snowfall, with 3 centimetres on average.
For more specific information about the climate of Nova Gorica, Slovenia, please take a look at the graphs shown below.
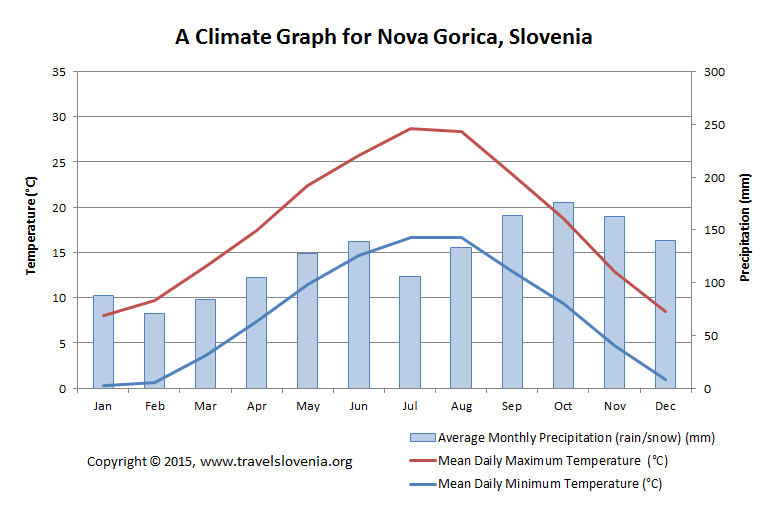
A climate graph for Nova Gorica, Slovenia showing mean daily maximum and minimum temperature for a month and average monthly precipitation (rain/snow).

Graph showing average monthly hours of sunshine and average monthly number of cloudy days for Nova Gorica, Slovenia.

Graph showing average monthly number of days with precipitation, average monthly number of days with snow cover and average monthly snowfall (in cm) for Nova Gorica, Slovenia.

Graph showing average monthly number of hot and cold days for Nova Gorica, Slovenia.